Neighbourhood Scoreboards
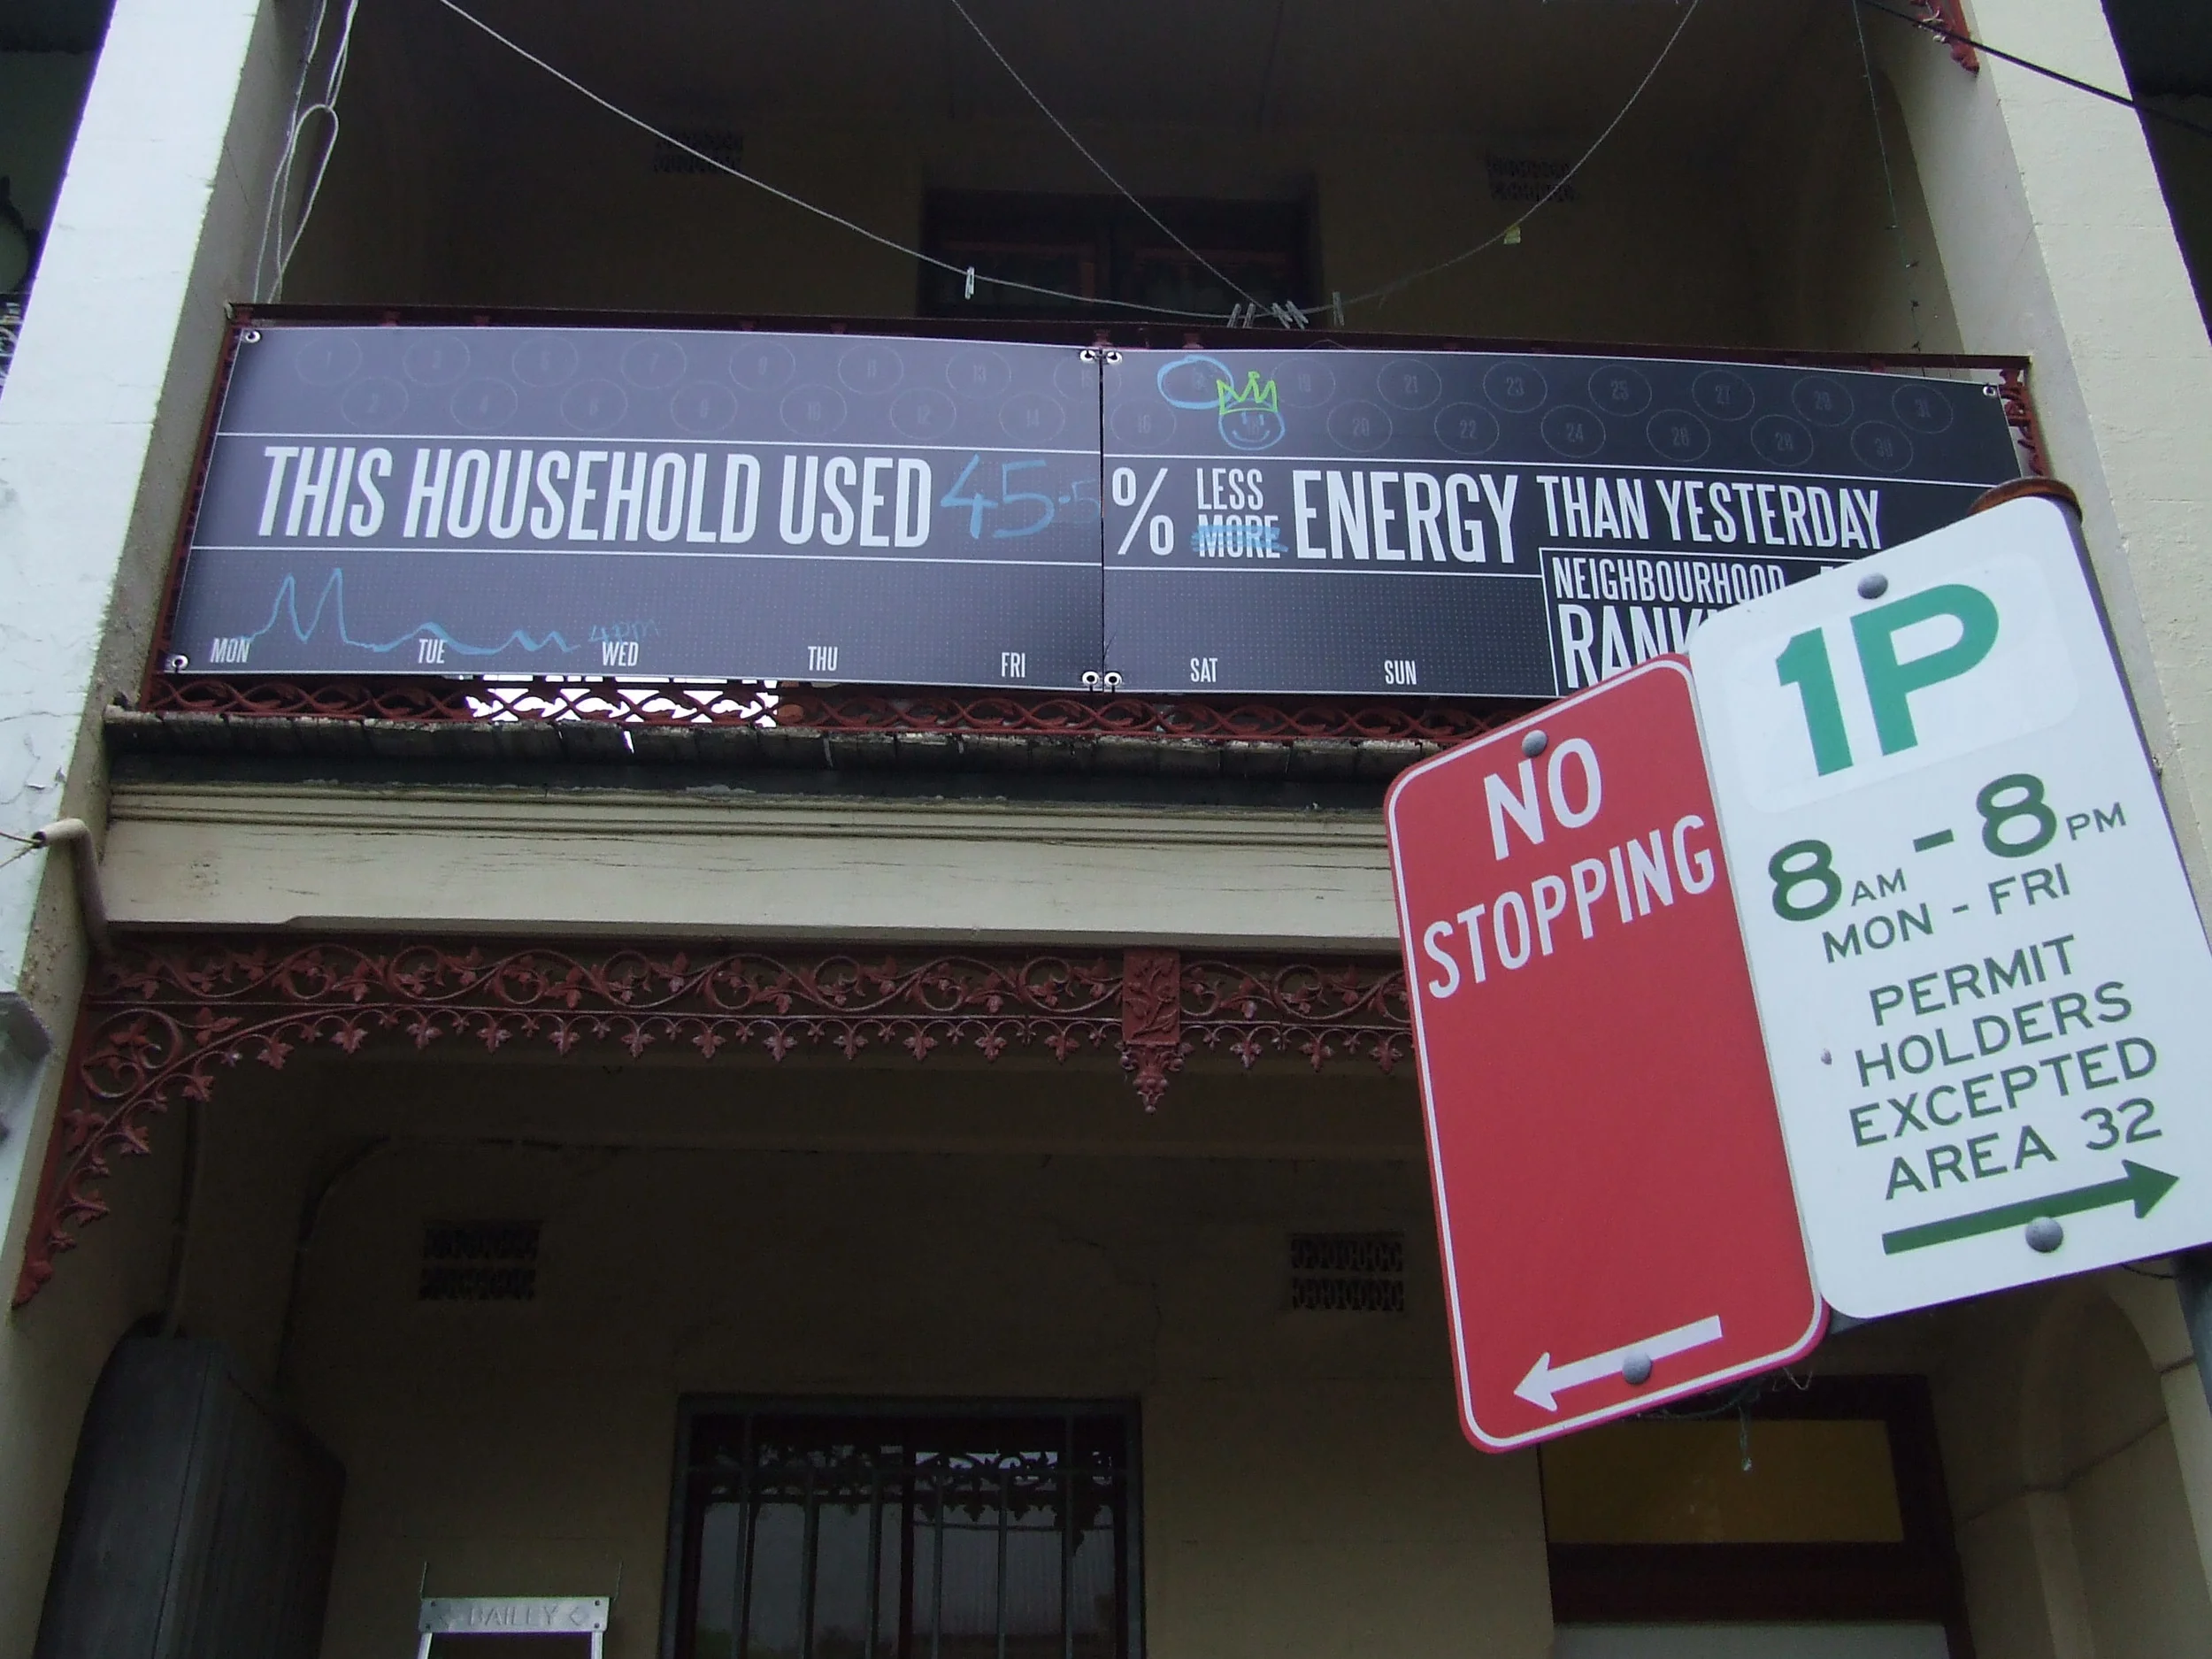
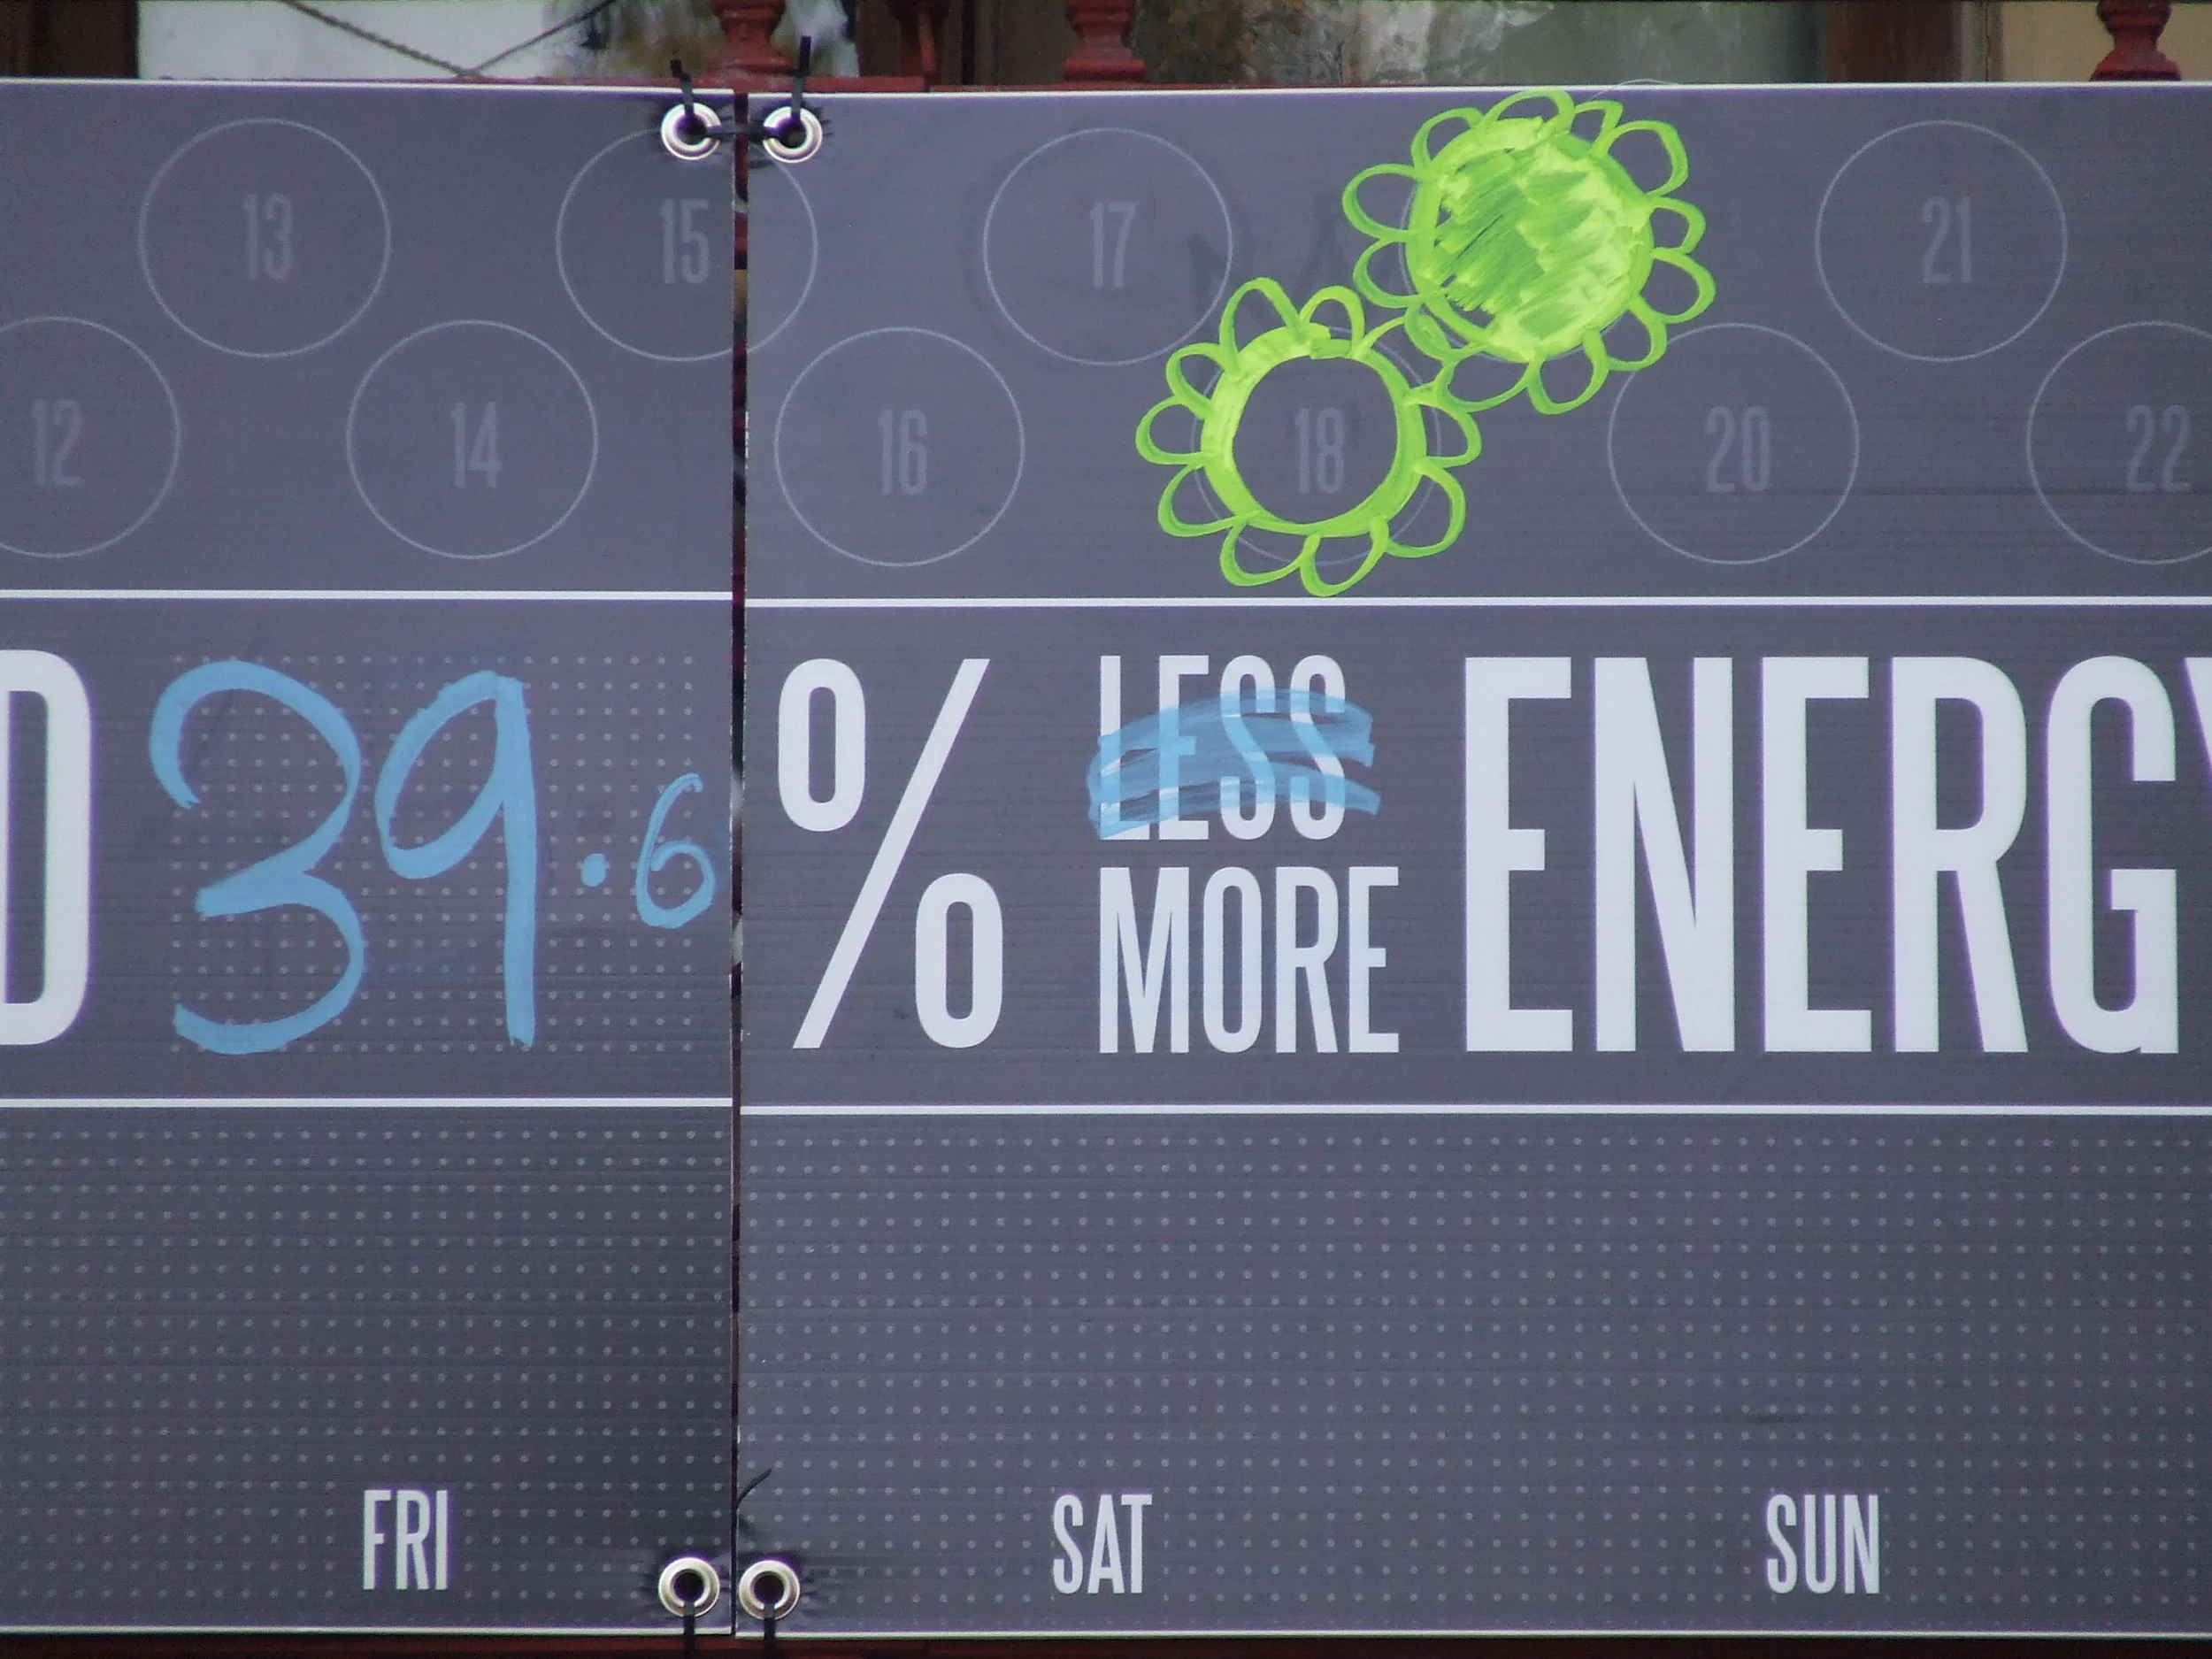
— The project investigates the effect of public exposure of domestic energy usage on house facades. From October to November 2010 five chalkboards as feedback displays were installed in a Sydney neighbourhood and manually updated each day. The visualisation included the change of electricity consumption compared to the previous day, a symbolic representation for each day of the current month, a graph representation for each week, and a daily neighbourhood ranking. Project team: Andrew Vande Moere, Martin Tomitsch, Monika Hoinkis, Elmar Trefz, Silje Johansen, Allison Jones, and more. Published at the 2011 INTERACT conference. Further details are available from the project website (archived version via Wayback Machine) and Vimeo. Photos by Nikash Singh and Martin Tomitsch.


